
The craft · how it's made
How it’s made
A Cityform plate is a real square kilometre — measured from the air, turned into a solid, and printed one layer at a time.
Nothing here is an artist’s impression. This is the long version: where the shape comes from, how a printer turns it into an object, what it’s made of, and what the scale lets you see. Jump to any part below.
Overview
From a kilometre of Britain to a 9 cm object
Every plate goes through the same four stages. The first two happen on a computer — turning open survey data into a solid model. The last two happen in the studio — printing it and finishing it by hand.
The whole pipeline, start to finish. Each stage is explained below.
Stage 01 · Survey
Measuring a real place
LIDAR — measuring the ground with light
The heights come from LIDAR (light detection and ranging). An aircraft flies a grid over the country firing a laser straight down — hundreds of thousands of pulses a second. Each pulse reflects off whatever it hits, and the time it takes to return gives the height of that point to within a few centimetres.
From a cloud of points to a grid
Raw LIDAR is messy: millions of scattered 3D points, no two evenly spaced. To be useful it’s resampled onto a regular one-metre grid — a height for every square metre, like pixels in an image where the value is elevation rather than colour.
What real LIDAR looks like
That is the principle. To see what a real square kilometre of survey data actually looks like — coloured by height, lit as relief, sliced and stood up in three dimensions — see The data behind every map.
Bare earth vs. everything on it
The same scan produces two surfaces. The DSM (digital surface model) keeps everything the laser saw first — roofs, trees, walls. The DTM (digital terrain model) strips those away to leave bare ground. Cityform builds from the surface model, because the buildings are the subject — but the terrain underneath is why a hill still reads as a hill.
OpenStreetMap — telling the heights apart
LIDAR knows how tall a thing is, but not what it is — it can’t tell a roof from a hill, or a canal from a road. OpenStreetMap fills that in: an open, community-drawn map where every building, street and waterway is a tagged shape. Every footprint you see was traced by a volunteer somewhere. I use it to decide which parts of the grid are buildings to raise and which are water to cut down.
Both datasets are public. Britain’s public bodies release their LIDAR under the Open Government Licence — the Environment Agency in England, the Scottish Remote Sensing Portal in Scotland, and Natural Resources Wales in Wales; OpenStreetMap is an open database built by volunteers. Cityform is only possible because that survey work is shared — so the attribution travels with every plate. More in Reference →
Why it matters
Measured ground, not a flat slab
Most free 3D map tools extrude building outlines to a guessed height and drop them on a flat base. Cityform sets the same streets on the real ground — the rise to a ridge, the fall to a river, the height of each block, all measured from the air. Below is the same square kilometre of Sheffield, from one camera. Drag the slider to compare: the only thing that changes is the data beneath it.

 OpenStreetMap only
Cityform · LIDAR
OpenStreetMap only
Cityform · LIDAR
The same 1 km² of Sheffield city centre, from one camera. Left of the line: OpenStreetMap footprints on a flat base. Right: the Cityform model on measured LIDAR terrain. Same streets — the difference is the ground beneath them.
Two more things the survey carries

 OpenStreetMap only
Cityform · LIDAR
OpenStreetMap only
Cityform · LIDAR

 OpenStreetMap only
Cityform · LIDAR
OpenStreetMap only
Cityform · LIDAR
Stage 02 · Model
Turning data into a printable solid
A printer can’t read a height grid or a map. It needs a single watertight mesh — a closed surface with no gaps or holes, so the software can tell exactly what is solid and what is air. A model with a hole in it is like a bucket with a hole: the slicer doesn’t know where to stop.
So I take a 1 km × 1 km crop, drape the OpenStreetMap footprints over the LIDAR height field, raise the buildings to their surveyed heights, cut the rivers and docks below the surface so a confluence reads as water rather than pavement, and seal the whole thing into one solid block sat on its base.
Because the plate is one continuous solid, anything that would hang in mid-air is filled in for strength. A bridge prints as a solid deck joined to the ground on each bank — the open span beneath it, and the cables or piers that would hold a real one, are closed in rather than left floating. Fine features like railings or a single narrow footbridge can merge into the surface. The footprint and position stay true to the survey; it’s only the unsupported structure underneath that’s solidified, so the model holds together in the hand and in the post.
Stage 03 · Print
How the printing works
The plates are made by FDM — fused deposition modelling, the most common kind of 3D printing. A spool of PLA is fed into a hot nozzle, melted, and laid down as a fine thread. The printer draws the model one flat slice at a time; each slice cools and sets, and the next is laid on top. Enough slices and a flat drawing becomes a solid object.
Slicing — turning a model into instructions
Before anything prints, software slices the 3D model into hundreds of horizontal layers and works out the path the nozzle must trace for each one. That path — every move and squirt of plastic — is what the machine actually follows.
Why the layer height matters
The thickness of each slice — the layer height — is the resolution. At 0.16 mm a ridge line, a viaduct or a railway cutting keeps its edge instead of blurring into a block. Thinner layers mean more detail and more time; 0.16 mm is the balance I’ve settled on, and a plate takes about 14 hours on a Bambu Lab machine.
Terrain helps: a city surface rises gradually rather than overhanging, so it mostly supports itself as it prints — no scaffolding to cut away afterwards, which keeps the finish clean.
Materials
What it’s made of
Each plate is printed in white PLA. PLA (polylactic acid) is a rigid plastic made from fermented plant sugar — corn or sugarcane — rather than crude oil. It prints sharply, holds fine detail, and reads as a clean matte white rather than a shiny plastic.
It is worth knowing where that plastic begins. PLA starts in a field rather than an oil well: plant sugar from corn or sugarcane is fermented into lactic acid, and that acid is joined into long chains and drawn into filament. So the white relief on the plate began as a crop — a renewable material rather than a petroleum one.
Why PLA, and not resin or PETG
Resin prints can be finer, but they’re brittle, can keep yellowing in light, and the process is messy and fume-heavy — wrong for an object meant to live in daylight on a shelf for years. PETG is genuinely tougher and far more heat- and UV-resistant — the better choice for something handled often or kept outdoors. It just prints glossier and fussier at sub-millimetre relief, where PLA’s matte, dimensionally sharp surface wins. For a piece that lives indoors on a shelf, PLA’s strengths are the ones that count.
The one thing PLA doesn’t like is heat — it softens well above room temperature, so the only place to avoid is a sunny windowsill or a radiator shelf. Indoors and out of direct sun, it lasts indefinitely.
The city sits on a separate graphite base (white on request), which carries the weight and frames the print the way a plinth frames a model.
Stage 04 · Finish
From print to object
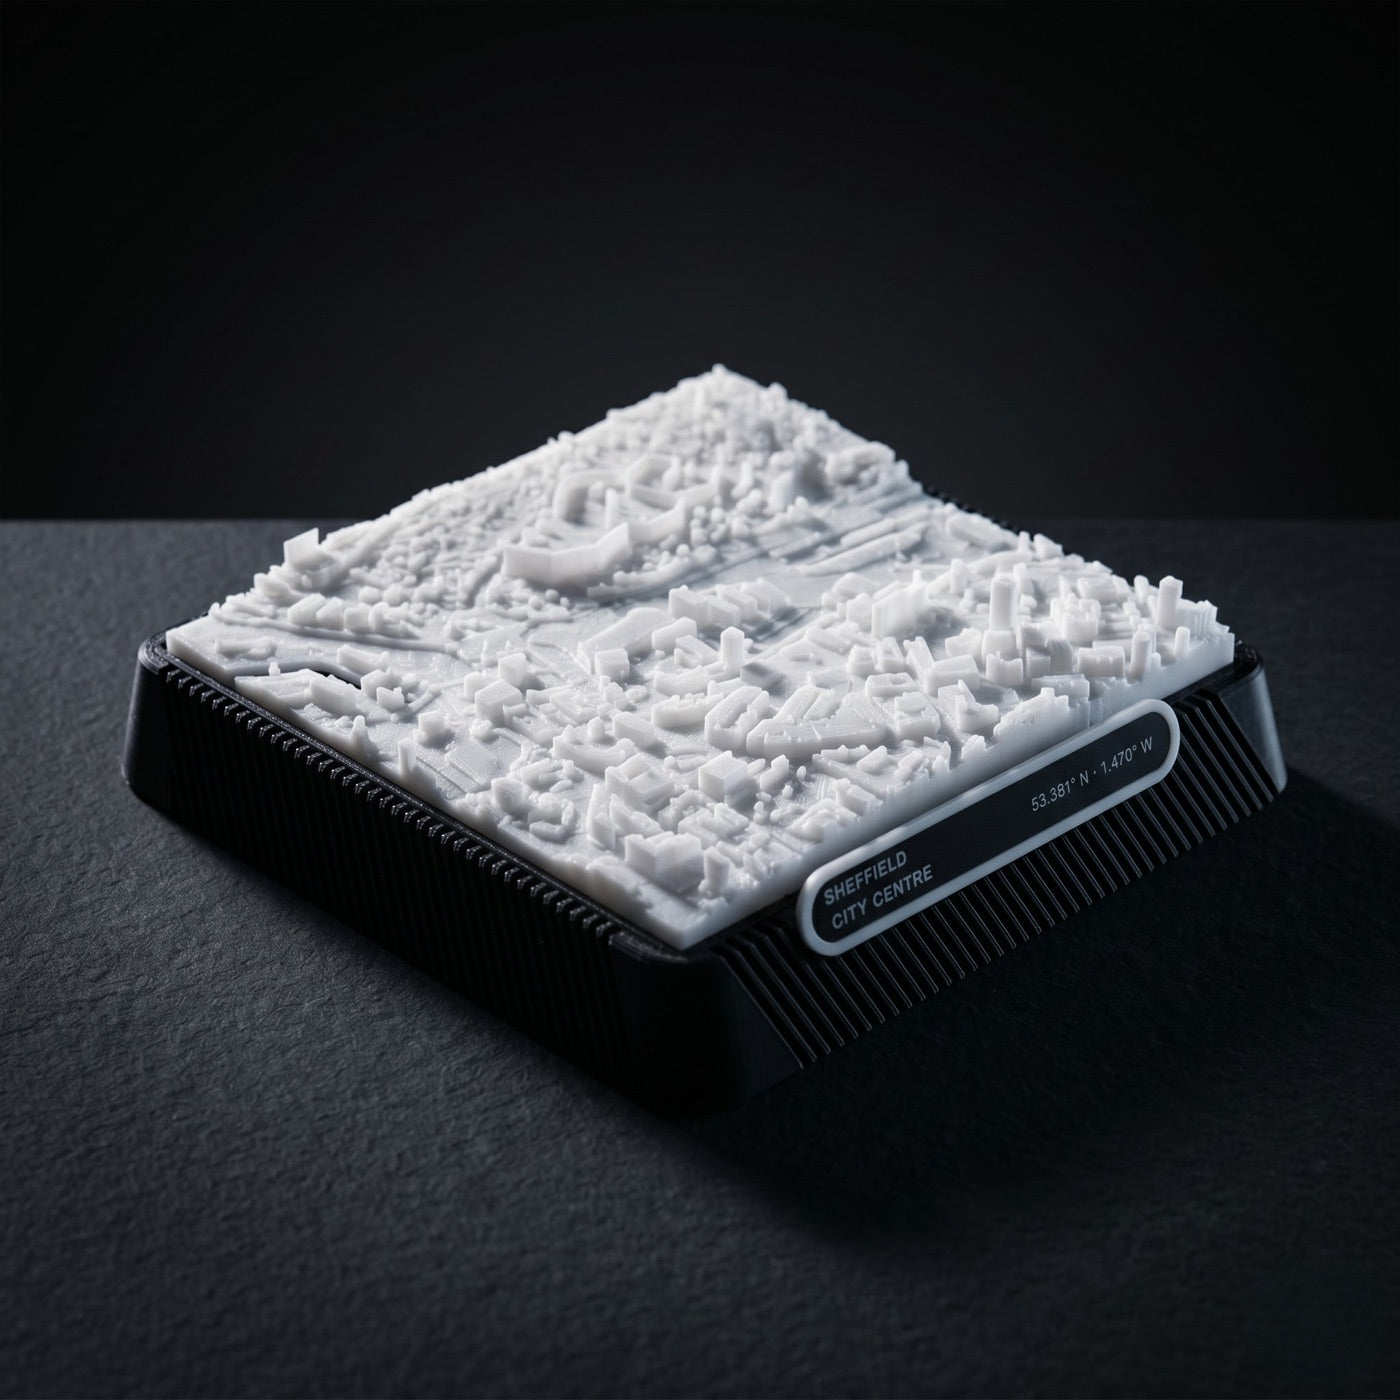
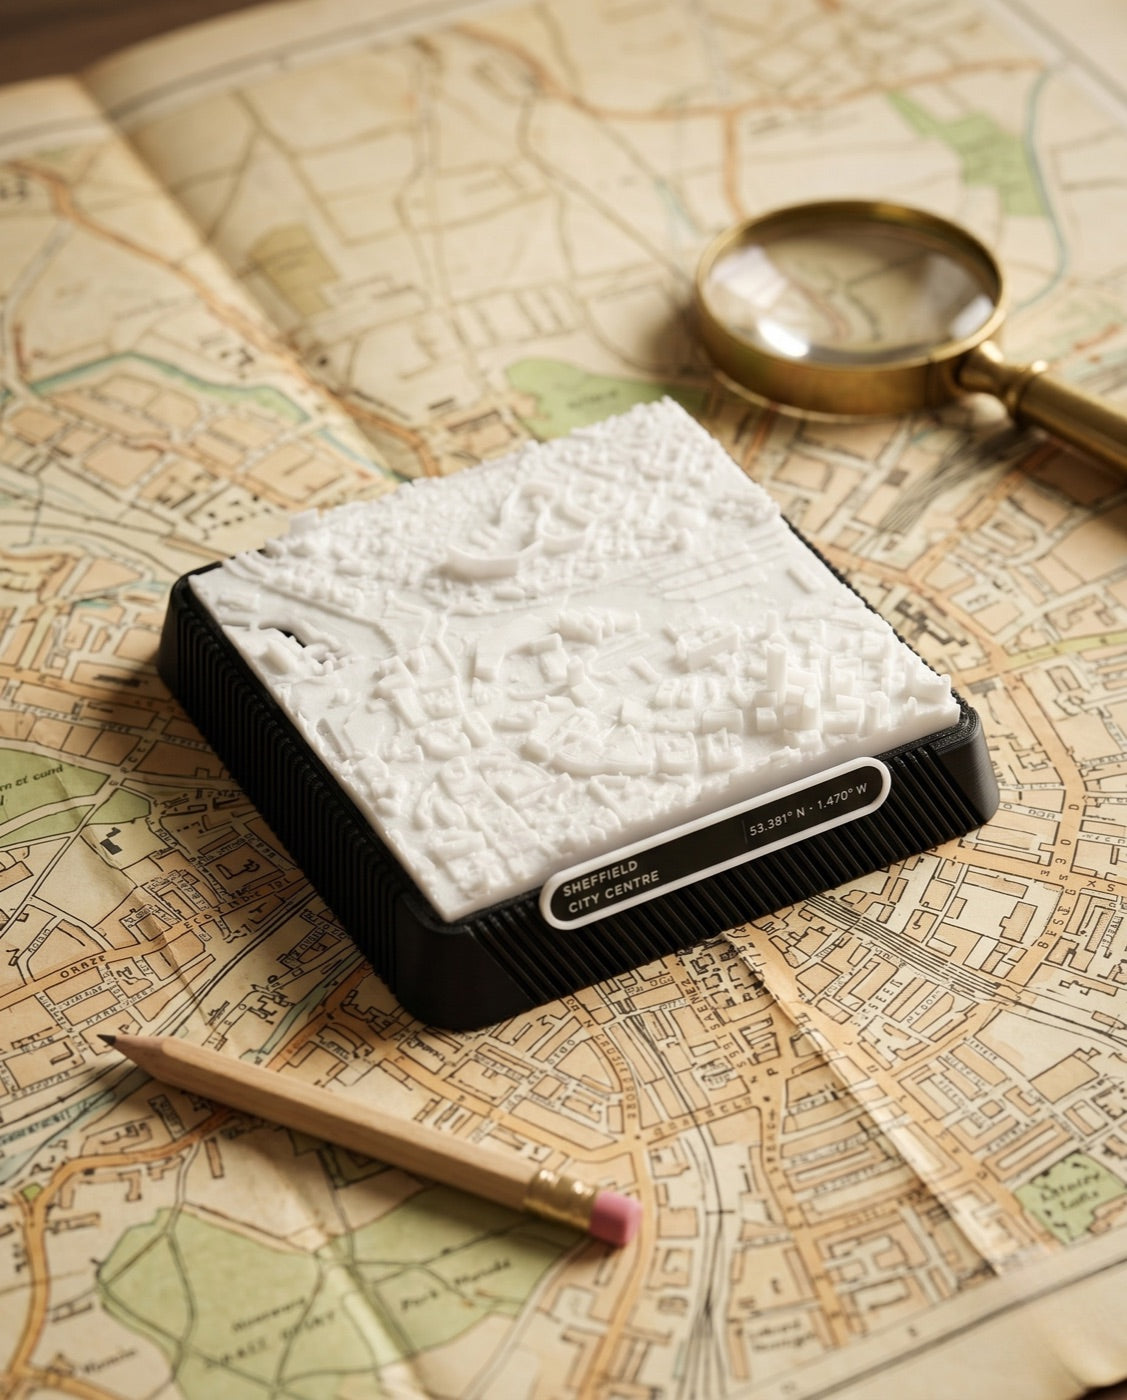
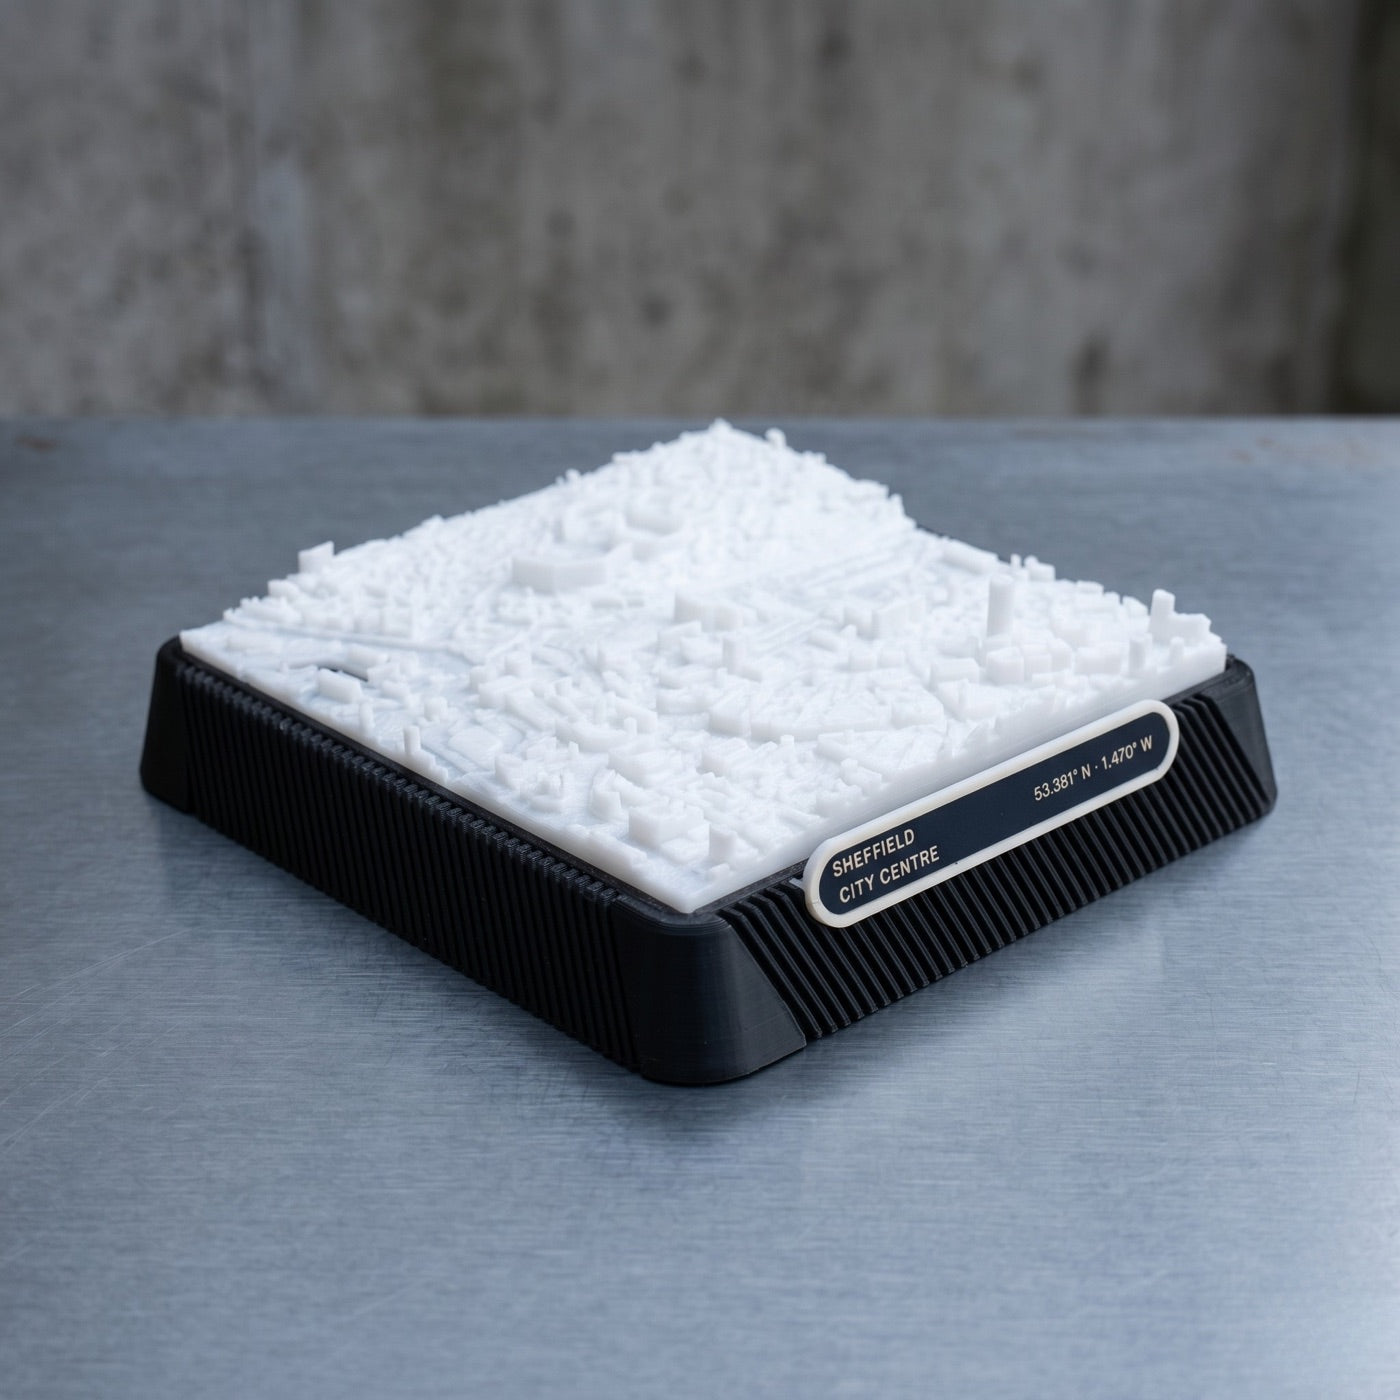
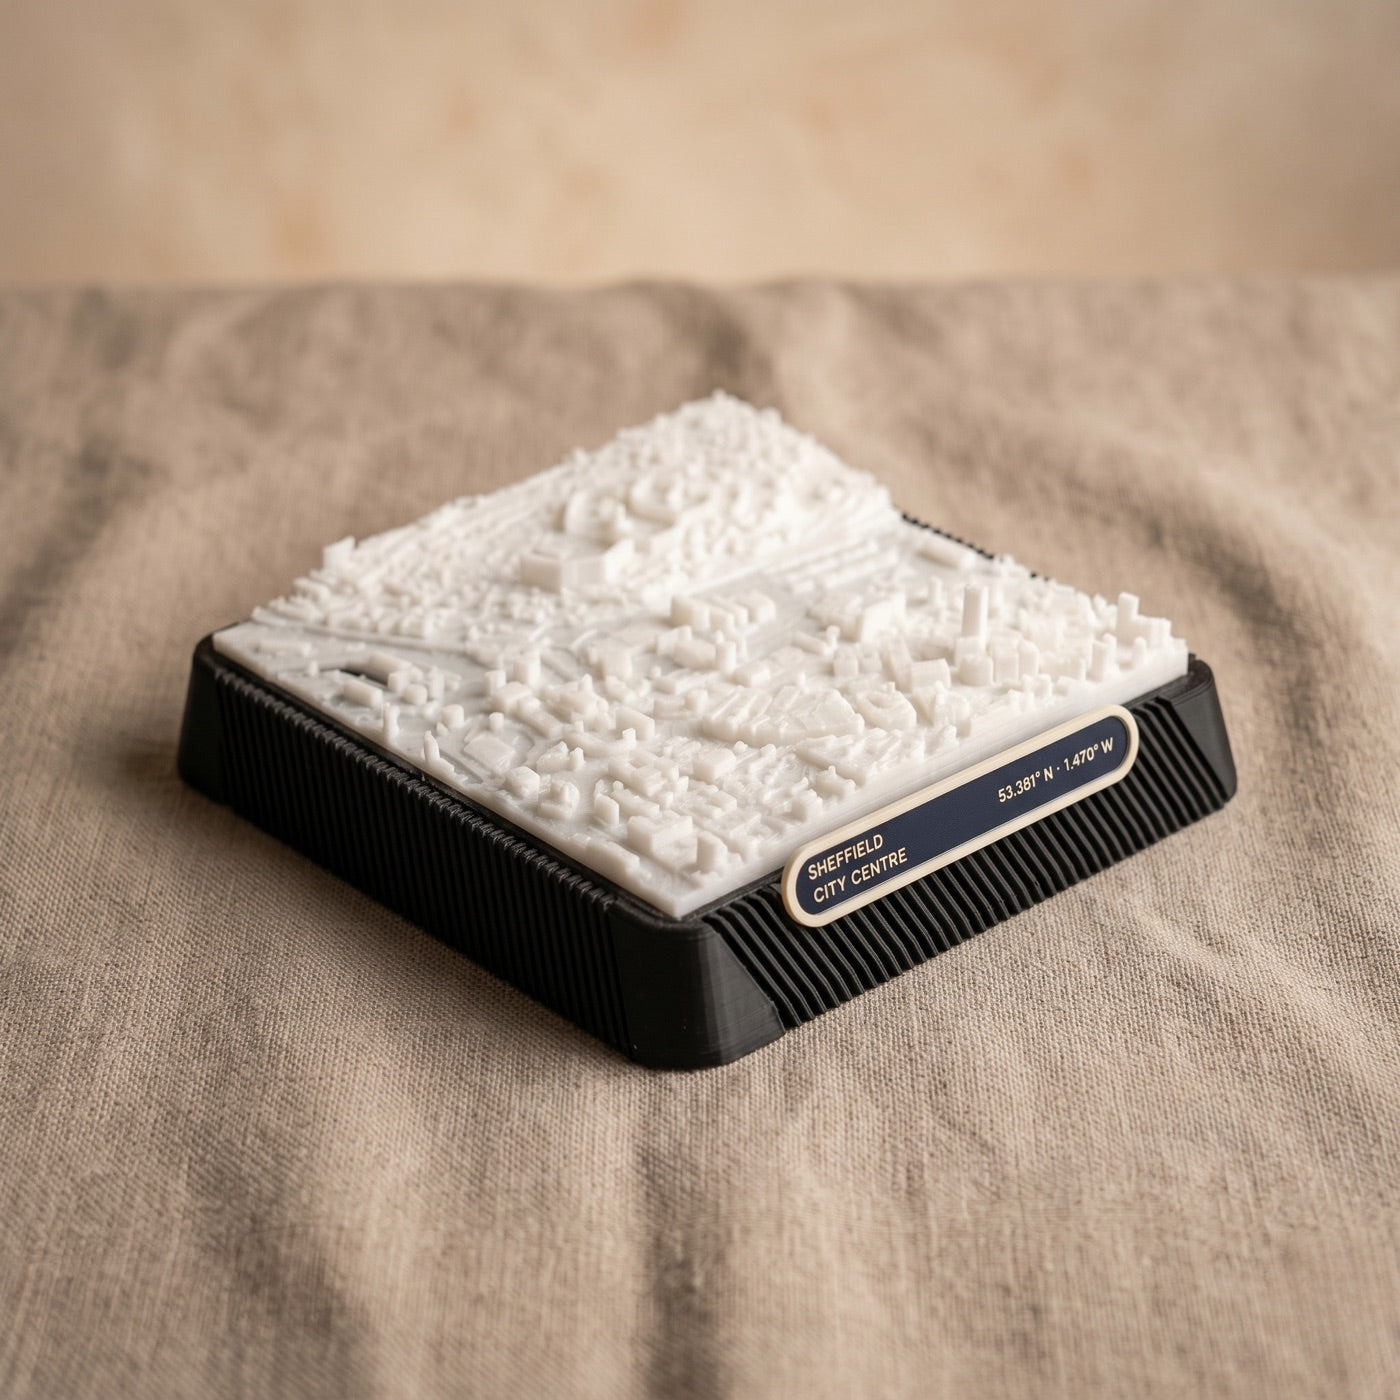
Off the printer, each plate is checked, cleaned up by hand, and seated on its base. A stainless-steel label is laser-engraved with the city name and its exact coordinates and set into the front — so even though individual houses are too small to resolve, the plate is precisely located.
Then it’s packed in a custom box and posted from Sheffield, usually within 7 working days for England (around 14 days for Wales and most of Scotland). One person, one kilometre at a time.
Put together, the work after the print leaves the bed runs in four steps, each done by hand:
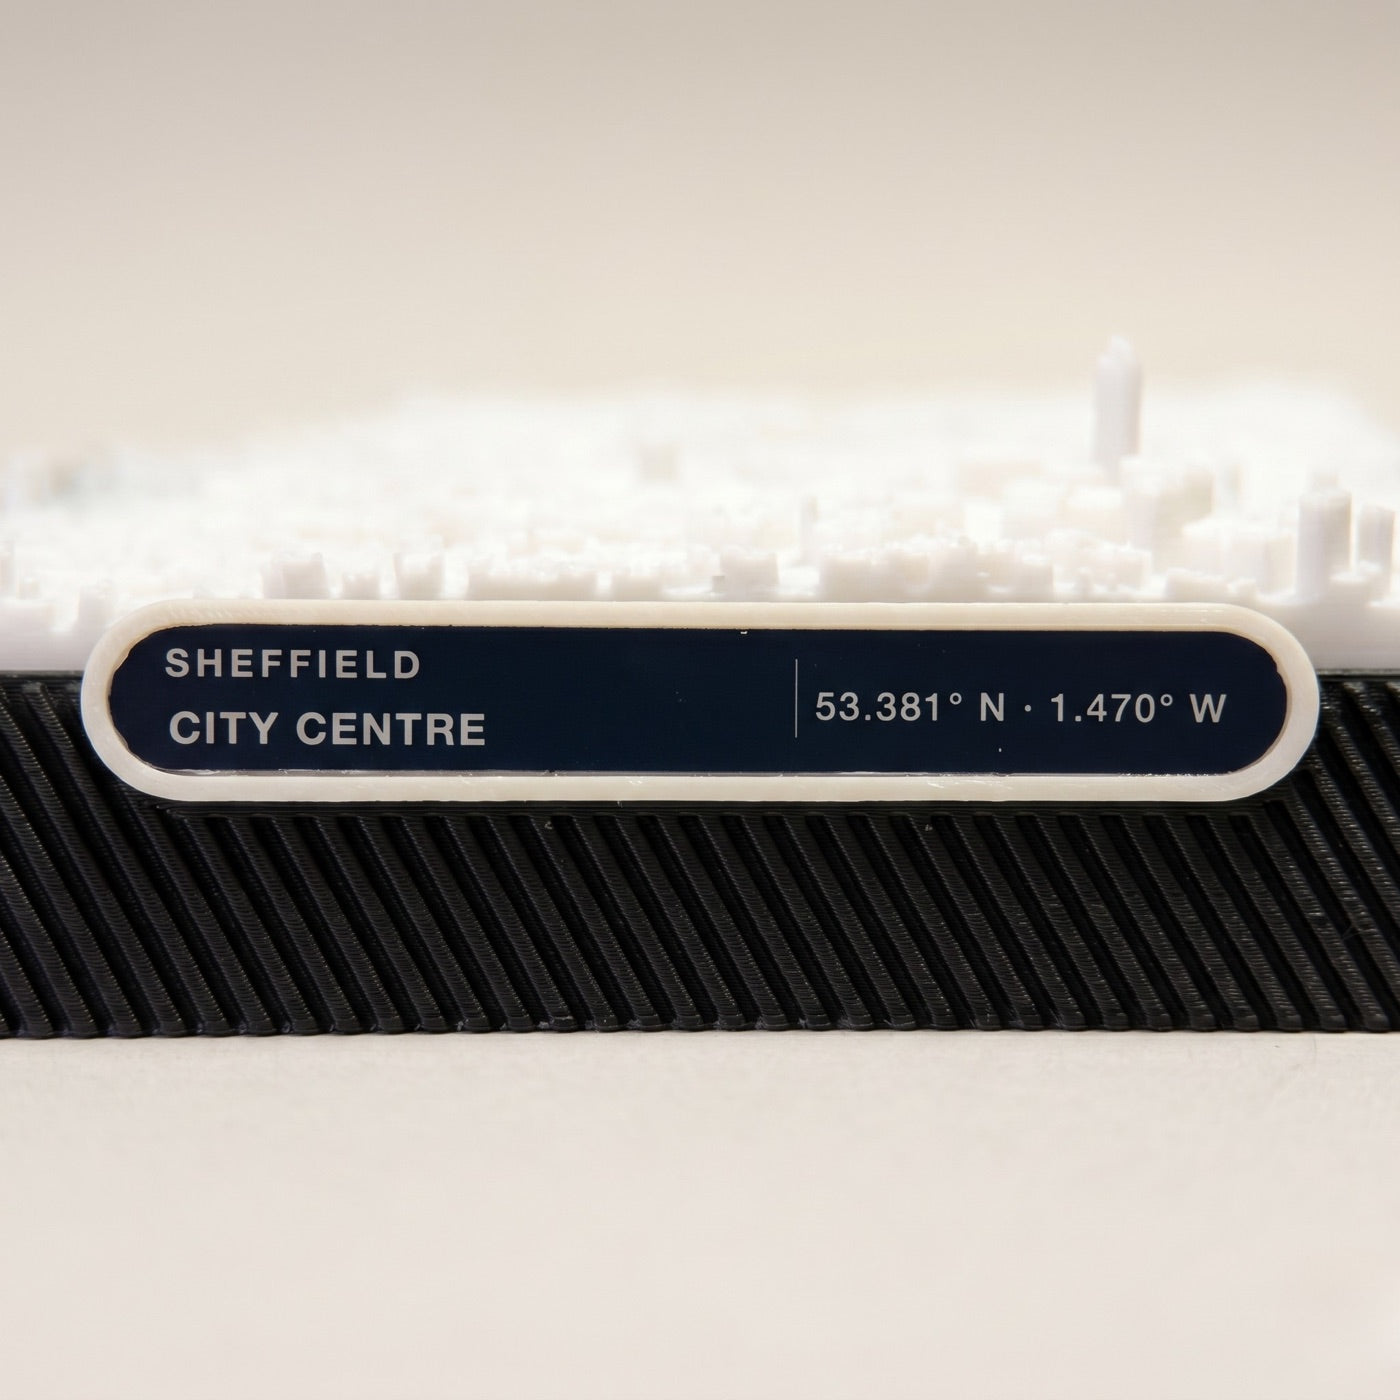
And those coordinates place it exactly. Read the latitude and longitude off the label, find them on any map, and you land in the middle of the very kilometre the plate shows.

Scale & detail
What 1:11000 means
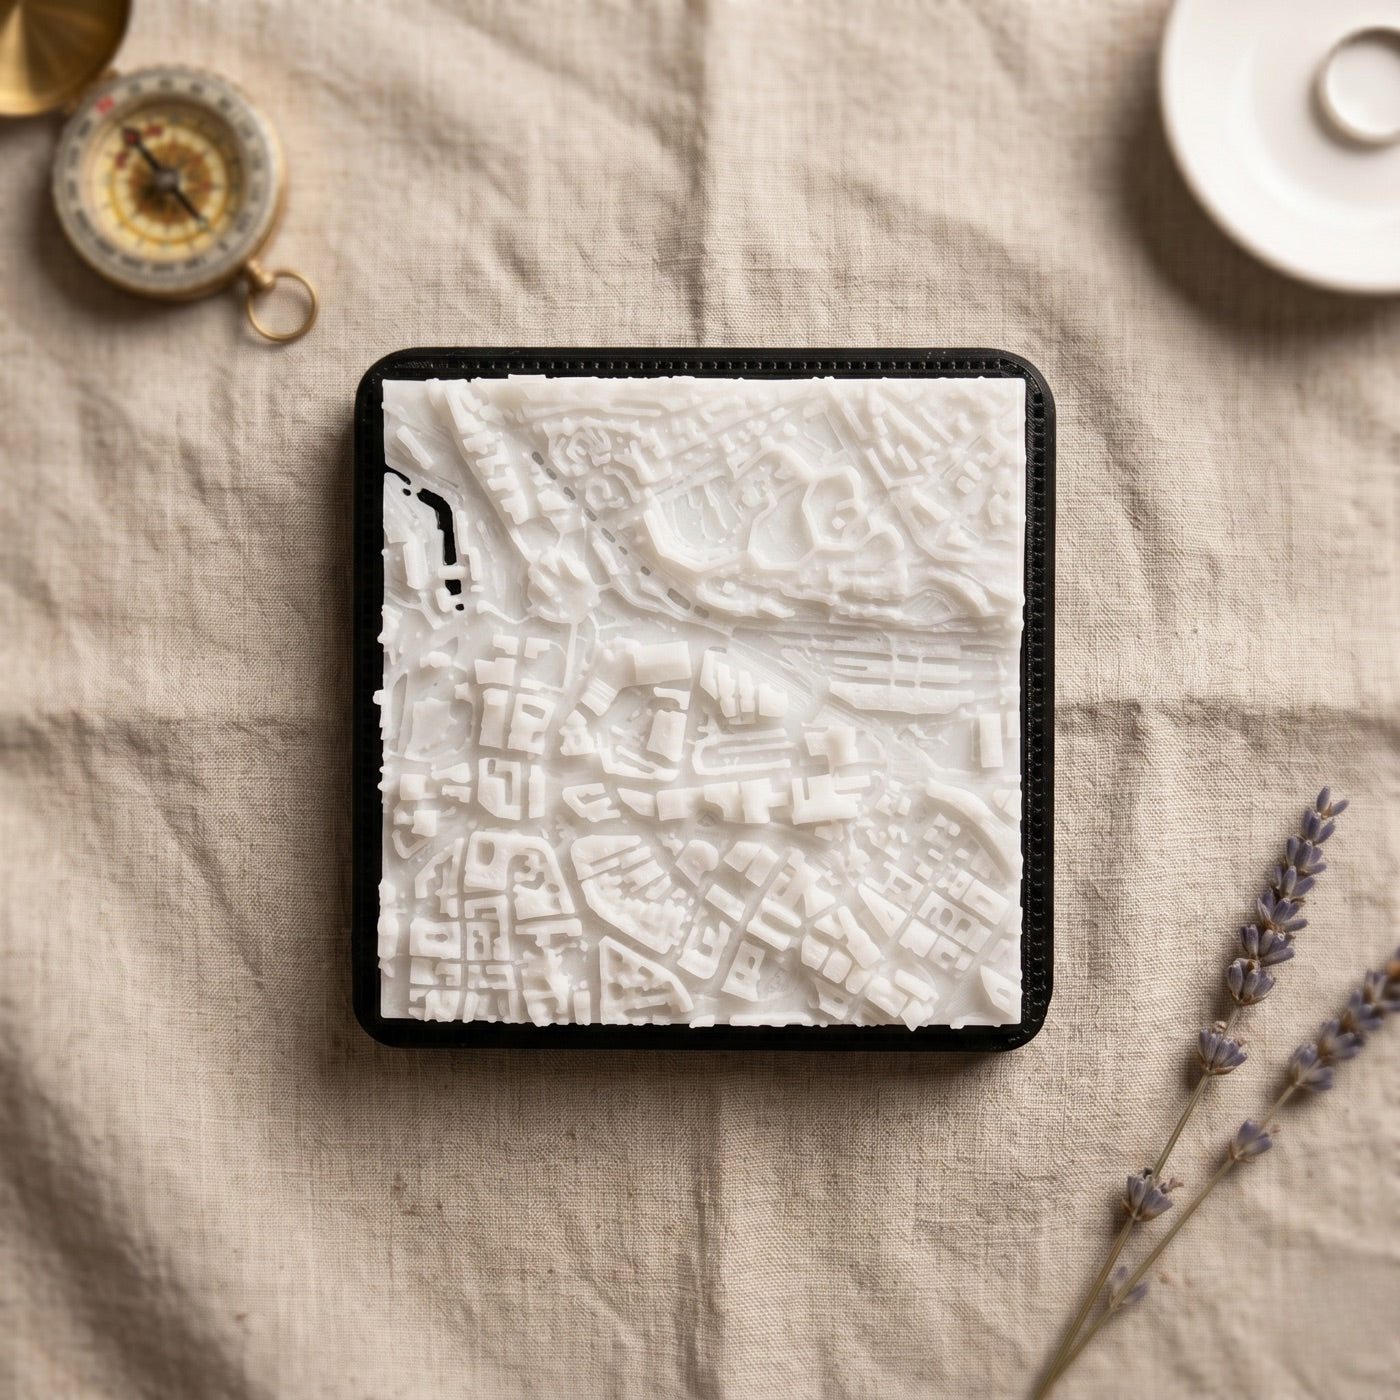
1:11000 is the scale — the model is 11,000 times smaller than the real place. One centimetre on the plate is 110 metres on the ground, so the whole 9 × 9 cm plate holds a square kilometre. At that size a football pitch is about a centimetre across — and a house is under a millimetre. So the plate shows you the shape of a place, not its front doors.
What you’ll recognise
- The street and block pattern
- The river, canal or coastline
- Hills, valleys, how the ground falls
- Major landmarks and large buildings
What you won’t pick out
- Individual houses, doors or windows
- House numbers, signs or your car
- Anything much smaller than a metre
The finished object — in millimetres
The map crop is nine centimetres square, but the object you hold is a little larger: a 105 × 105 mm base, 17 mm deep, with the white relief rising on top. The relief height changes from city to city — flat centres sit low, hilly ones stand taller — so the total height varies. A removable stainless-steel label carries the city name and coordinates.
Why one kilometre, at nine centimetres
A square kilometre is about the size of a place you actually know on foot — a town centre, the walk to the station, the streets around a childhood home. Smaller and you lose the context; larger and the detail shrinks past reading. At 9 cm the result sits in the hand and on a shelf, close enough to find one terrace, wide enough to read a whole centre.
What the survey can’t show
It’s built from real data, but data has edges. Worth knowing before you order:
- New buildings lag. If something went up after the last survey, it may be missing or shown as the site that was there before.
- Trees are simplified. Canopy reads as soft mass, not individual branches.
- Coverage has gaps. LIDAR is thinner near the edges of Welsh and Scottish coverage; a few squares come back flat or as water.
- Every order is checked. If a chosen kilometre can’t be produced to spec, you hear within 48 hours — full refund, or the nearest workable square.
Reference
Open data & a short glossary
Cityform stands on public survey work. Two open datasets do the heavy lifting, and both ask that their attribution travels with anything made from them — so it’s on the box, the listing, and the footer of this site.
Public-sector LIDAR — open terrain and surface heights from the Environment Agency (England), the Scottish Remote Sensing Portal (Scotland) and Natural Resources Wales (Wales), all licensed under the Open Government Licence. OpenStreetMap — community-mapped footprints for buildings, roads and water, under the ODbL. Open data is the whole reason a one-person studio can make a faithful model of anywhere in Britain.
Coverage is not even across the country — see the national map on The data behind every map.
| Dataset | What it provides | Accuracy | Licence |
|---|---|---|---|
| Public-sector LIDAR | Ground and surface heights, measured from aircraft — Environment Agency (England), Scottish Remote Sensing Portal, Natural Resources Wales | To a few centimetres vertically | Open Government Licence v3.0 |
| OpenStreetMap | Building footprints, roads, and water | Community-mapped vector data | ODbL |
- LIDAR
- Light detection and ranging — measuring distance (and so height) by timing laser pulses.
- Point cloud
- The raw scan: millions of scattered 3D points, before they’re tidied into a grid.
- DTM / DSM
- Digital terrain model (bare ground) vs. digital surface model (ground plus buildings and trees).
- Mesh
- A 3D surface made of joined triangles. It must be “watertight” — fully sealed — to print.
- FDM
- Fused deposition modelling: building an object by laying down melted plastic in layers.
- Slicing
- Converting a 3D model into the layer-by-layer paths the printer follows.
- PLA
- A rigid plastic made from plant sugar; the matte white the plates are printed in.
Practical questions — durability, base colours, lead times — are answered on the Studio page.
Heights from public-sector LIDAR — Environment Agency (England), Scottish Remote Sensing Portal (Scotland) and Natural Resources Wales (Wales) — licensed under the
Open Government Licence v3.0.
Footprints © OpenStreetMap contributors, licensed under the
ODbL.